Sunday, September 6, 2020

Dynamic Sales Dashboard using Microsoft Excel


Dynamic Sales Dashboard using Microsoft Excel Template:


Description About Template:

Sales dashboards are one of the most popular excel tool for sales data visualization. Dynamic Sales Dashboard offers a complete autonomous data visualization of your business. Monitoring and tracking the sales is very crucial and may impact on your monthly/ quarterly sales targeted. The Dynamic Sales Dashboard offered by the Excel Solution provides the dynamic and autonomies visualization of your sales data.

Features:

First of all, you need to follow the below steps to get the Dashboard for your Sales Data

·         Paste or enter your data as per the prescribed format in “Sales Entry” menu

·         If you are pasting the existing data, please ensure the data shall be pasted under right Table heading and only values without format shall be pasted to maintain the template format.

·         You can change the Table Heads as per your requirement

·         You can change the Chart Name as per your requirement

Sales Entry:
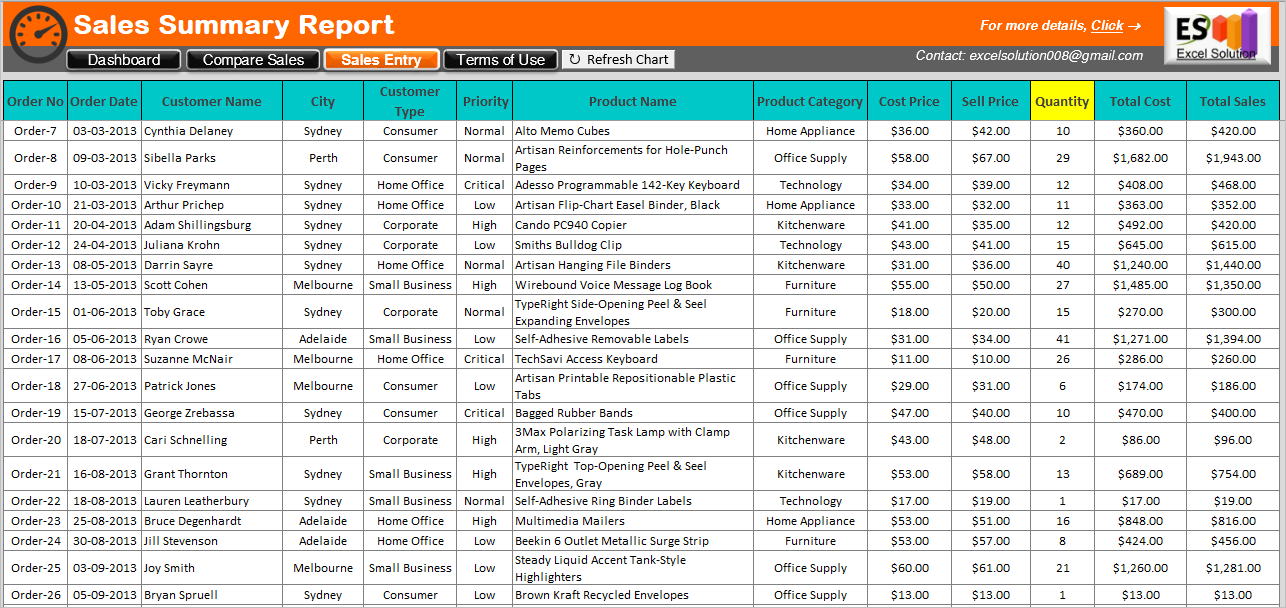
In the Sales Entry menu bar, paste or insert the data as per the format of the excel template. All the data as per the table is mandatory.

You can modify the table heading as per the requirement. Total Cost is the cost price of all Quantity. Total Sales is the sales price of all quantity.

Insert the sales data in “Sales Entry” menu bar in the excel template. Later than, by clicking on “Refresh Chart”, all the charts and graphs of the excel template will change automatically.

Dashboard:

Dashboard is fully dynamic and provides visual presentation of Sales Data. The Dashboard summaries the various details including, total sales, profit/ loss, sales distribution based on their emergency, category, customer type, etc. Certain navigation buttons are also available to get the Dashboard for a specific timeline.

Menu Bar:

Interactive Menu bar to redirect between multiple pages is provided at the top of the Tool. There are five (5) buttons Each button navigates to the respective sheet.

The selected sheet is highlighted with the different colour (Dashboard is selected in above pic). Refresh Chart buttons will update the Chart when Sales Entry is modified or changed.

At the right side corner, the Contact details and website address can be accessed by clicking on the Excel Solution button.

Dashboard Navigation:

Navigation Panel used to select a specific range of data from the available range. By default, all data range is selected. You can select a single or multiple year or months from available data range.

Total Sales and Profit:

This table provides summary of your total sales value and profit gained. The Profit is provided in terms of amount as well as in percentage. For the easiness of tracking, the dynamic color coding is defined. Green color is defined for to indicate the revenue profit and Red color is defined to indicate the revenue loss.

Sales Summary:

Column chart indicates the summary of gross sales. You can select any specific month or year from the Dashboard Navigation panel and to see the gross sales in that particular month or year.

Order Priority:


The orders which are fulfilled based on its priority, is also summarized through a bar chart.

Product Category Trend:

For the quick understanding the product trend based on all past orders/ sales, the Trend chart is prepared.

Sales Distribution:

Based on the order delivery in the specific region, the Pie chart is prepared to provide visualization of Sales distribution in all past sales.

Customer Type:

For the targeted customer in history of sales, the radar chart is provided.

Compare Sales:

Comparing your products in terms of total sales, profit may useful to take future business decision. With this comparison chart, you can compare any two products for its Total Sales, Quantity, Profit, Profit%.

You can select from the drop down menu (right side top corner) to see the comparison statement. Also from the side navigation, you can select any product see its performance graph.

This Comparison graph is also fully dynamic and update with respect to change in the sales entry.

Charges:

  • Per User Charge: $ 9.99 FREE
We are doing this work for non-profit charity purpose. If you feel this tool is useful to you and worth, you can make any amount as a payment through below payment links. Total Payment we receive, will be used for good cause, charity works for orphans, street dogs, cow houses and needy people.

Payment Method:

Download:

Download the Dynamic Sales Dashboard by below Download Button. User manual is also provided along with Excel template for easy operation.


Other Relevant Posts:

  • Simple Project Management Dashboard using Microsoft excel.
  • How to use SPARKLINE function in Google Sheets?
  • How to use the IF function in Microsoft excel?
  • How to use the DAYS function in Microsoft excel?
  • How to use the COUNT function in Microsoft excel?
  • How to use the SUM function in Microsoft excel?
  • Calculator using VBA in Microsoft Excel.

Saturday, May 23, 2020

Simple Project Management Dashboard using Microsoft Excel

Simple Project Management Dashboard using Microsoft Excel


PREAMBLE:

In any project of whatsoever nature, task management is the vital activity to measure the key performance metrics of the project team to complete the project on or before the time.

In order to provide such a solution, our Project Management Dashboard Tool is the dedicated solution for tracking project, task management, visual presentation through interactive auto updated dashboard and Gantt chart.

Today purchasing project management software’s for all the organizations or small enterprises is not possible due to its huge cost, especially for those, this Project Management Tool is the best solution.

This Project Management Dashboard tool using Microsoft Excel is useful in almost all types of industry sectors Vide Sales & Marketing, Engineering, Finance, IT, Health care, Research & Development, Real Estate, Quality, Procurement, Supply & logistic, Construction companies, Manufacturer, Human Resource, and etc.

Aside this Project Management Tool is also useful for tracking all your personal activities in routine life as well.

You can download demo version of this Project Management Dashboard tool at the link provided in this post at "Download" section.


SYSTEM REQUIREMENTS:

The Project Management Dashboard tool is workable in all systems having MS office version MS 2010 and later. Preferable versions are MS 2013 or 2016.

Anyone who can operate the Microsoft excel at basic level, can operate this project management tool and modify as per their own requirement.


DASHBOARD:


Project Dashboards is the visual presentation of the project data provided by team members of the Project.

Project Dashboards give the overall idea about what are the total tasks associated with the project, how many tasks are completed, in progress or pending and the tasks which are targeted on certain time lines but not initiated or completed within desired time schedule.

Dashboard is integrated with the project data and will automatically update when the status of task or project is updated.


GANTT CHART:


Gantt chart is a great way to understand how much for each of the task associated with the projects are allotted. It will also visualize the project or task workflow.

In Gantt chart, you can change the weekly off or holidays as per your requirement. 

In this case, using complicated software may waste a time and cost where this simple Gantt chart using Excel is the best and easy solution for this.

If you are:

Project Manager, you can have a high level view and real time data of the projects;

Team Leader, you can see a key metrics of the task allotted to your team members;

Finance Officer, you can perform management tracking;

Business Development, you can get the overall business intelligence;


TASK-MASTER:


Task-master is the key page of the Project Management Tool. Here all the tasks are listed with all minimum details including task name, task owner, other associated team members, task schedule and target completion and status of the project.

Basically this sheet is the database of the entire project which is bifurcated in all micro leveled tasks or activities related to the project.

In this sheet, you will be required to identify each task of the project along with its workflow and timeline.

Once you prepare the Database with all such information, you only need to update the %completion column only. Balance all status of the Dashboard, Gantt chart and Task Master sheet will be automatically changed.

Creating more powerful and accurate tracking of the project, micro leveled tasks shall be identified and listed in this sheet. More Accuracy in the database will give more accurate results.


CHARGES:

  1. Charges per user: $ 19.99 FREE

We are doing this work for non-profit charity purpose. If you feel this tool is useful to you and worth, you can make any amount as a payment through below payment links. Total Payment we receive, will be used for good cause, charity works for orphans, street dogs, cow houses and needy people.


PAYMENT METHODS:


PAYMENT TOWARDS CHARITY:

The part of the amount which you spent to purchase this Project Management Tool will be utilized in the charity works for a good cause including help to poor and needy people, orphans, old-age home, cow-house, cow fodders, etc.


DOWNLOAD:

Demo version of the Project Management Dashboard Template is completely free and can downloaded from below button. 


See Other useful information about Microsoft excel function and its working at Excel Solution